Mesh Editor
Desktop application designed to turn raster images into low poly vector art Github
- Live Delaunay Triangulation and dual Voronoi Diagram
- Export to SVG
- Colors dynamically sampled from image
- Layer control & blending
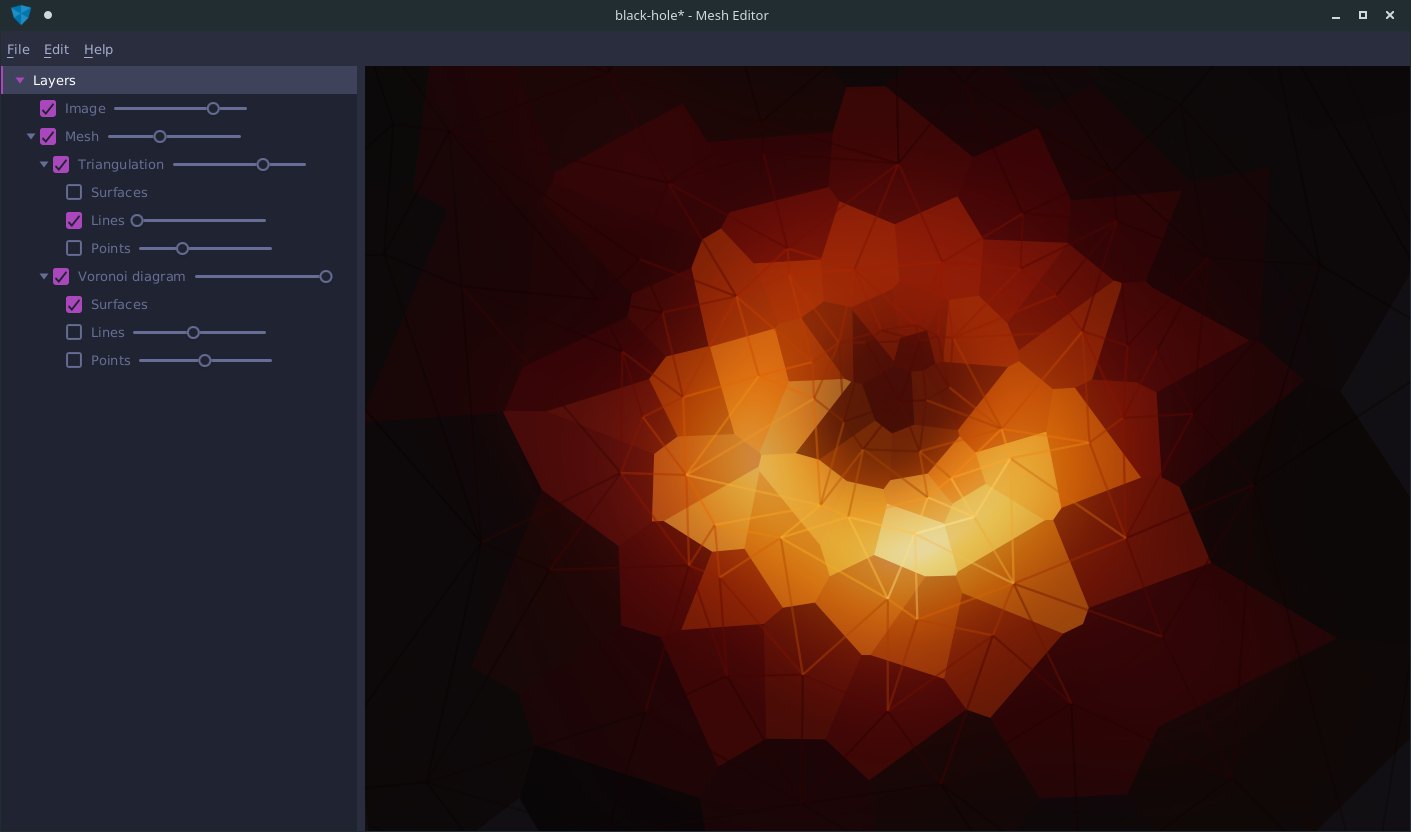
Layers
An interactive showcase


Observetree Library Github Maven
Observetree is a library that extends the classic Observable pattern by integrating it in a graph structure.- Events are propagated through the Observable tree
- Listeners can be assigned a priority to control the order at which they are called
- All events in a tree can be accumulated and distributed at once
Experience
Technologies
- Java
- C#
- Dart
- Python
- C / C++
- JS / TS
- Version controlGit
- TestingJUnit, Mockito
- Build automationMaven
- Dependency injectionGuice
- Issue trackingJIRA
- DeploymentAnsible
- Code qualitySonar
- CITravis CI
- WebAngular, SASS
- MobileFlutter
- GamesUnity
- AgileScrum
- Linux user, bash
- LaTeX
Work Experience
- Development & DevOps - in Dynatrace product Demo team (Servers, Cloud, Deployment/Ansible)
- Designed, implemented, integrated and tested a load generator solution imitating complex, time-dependent user actions for the Demo environment (Java, DSL, multithreaded)
- Maintained & updated various parts of a environment including building, updating and automating deployment of Apache server with PHP using Ansible
- Mobile Flutter banking app for UniCredit (Flutter, BLOC pattern, Dart)
- Online banking product for BNP Paribas bank (Java EE, Oracle DB, WebSphere Server, PL/SQL)
R&D - Hybrid web app allowing for automatic data extraction from document pictures - 6 months (Ionic/Angular, JavaEE, Tesseract, OpenCV)
Projects
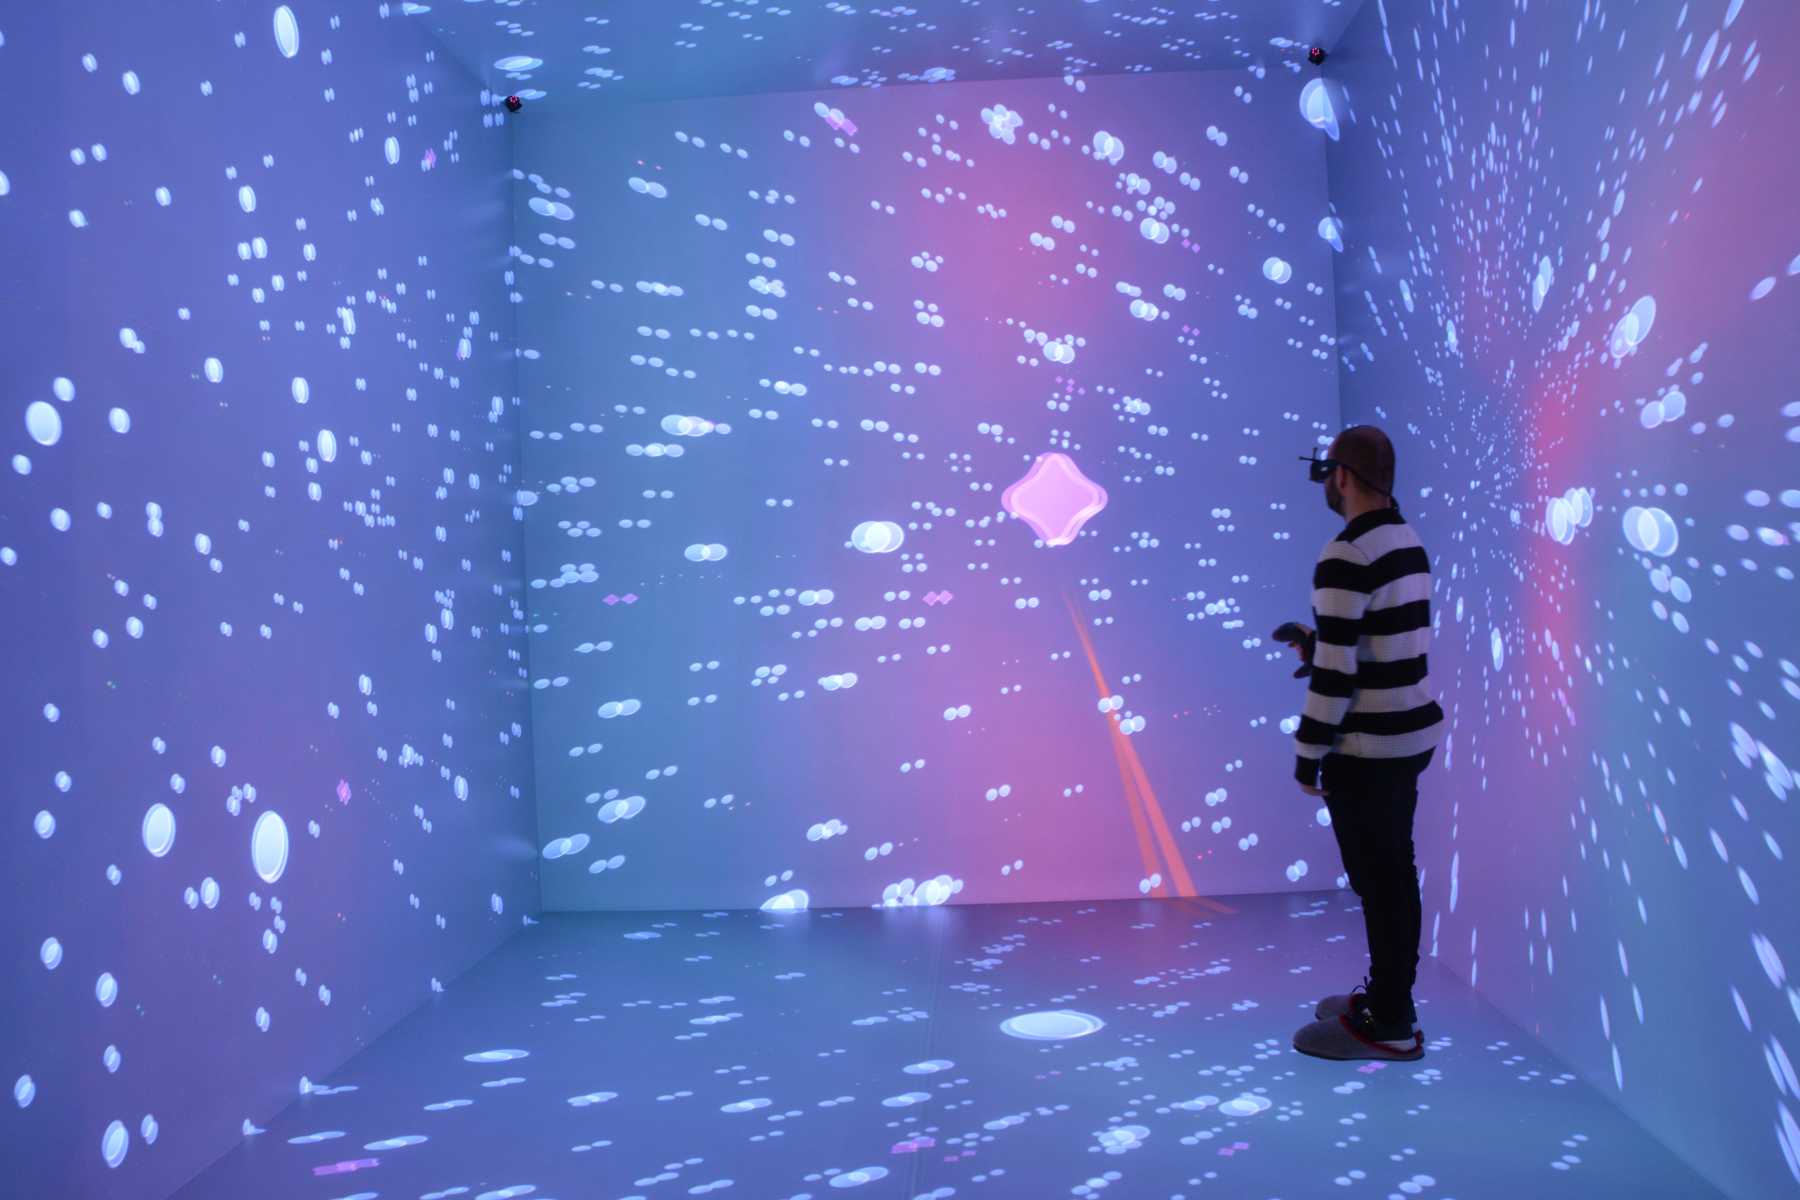
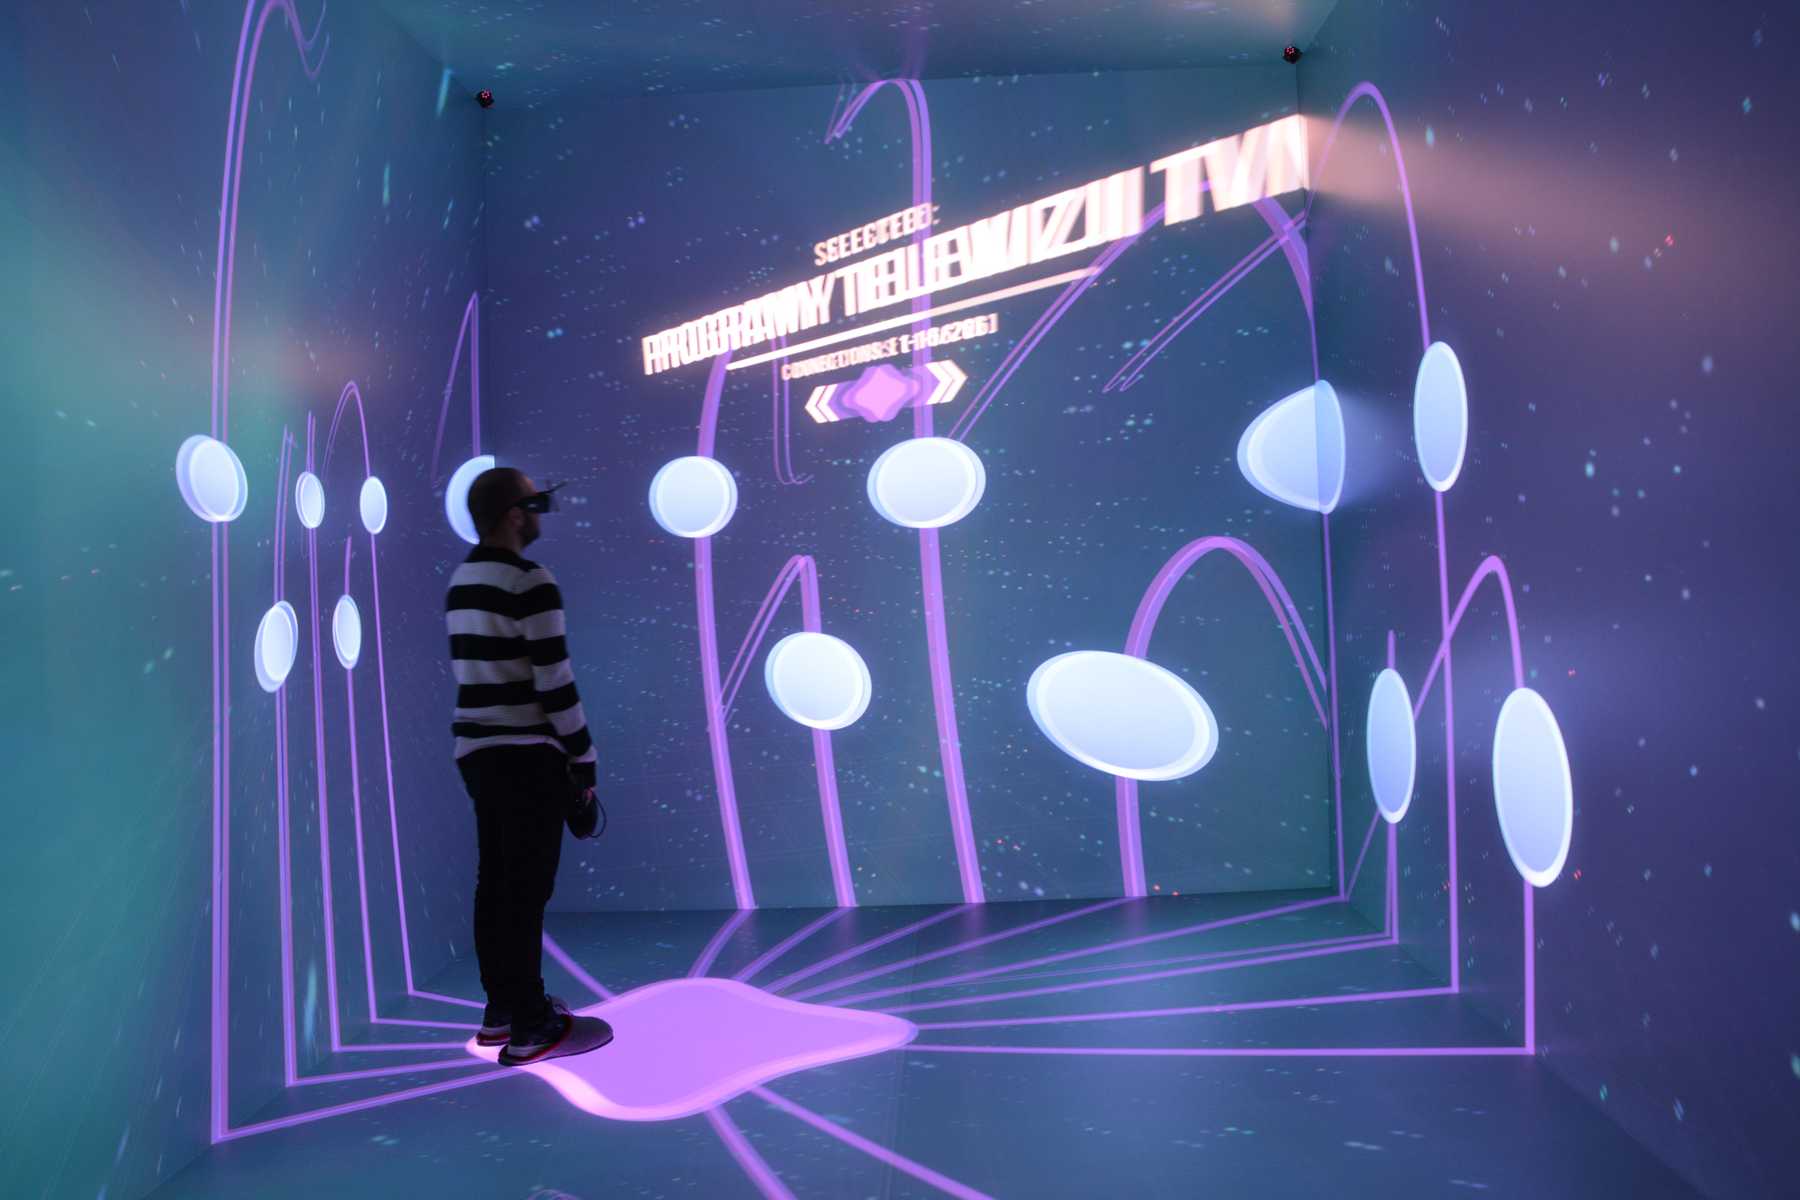
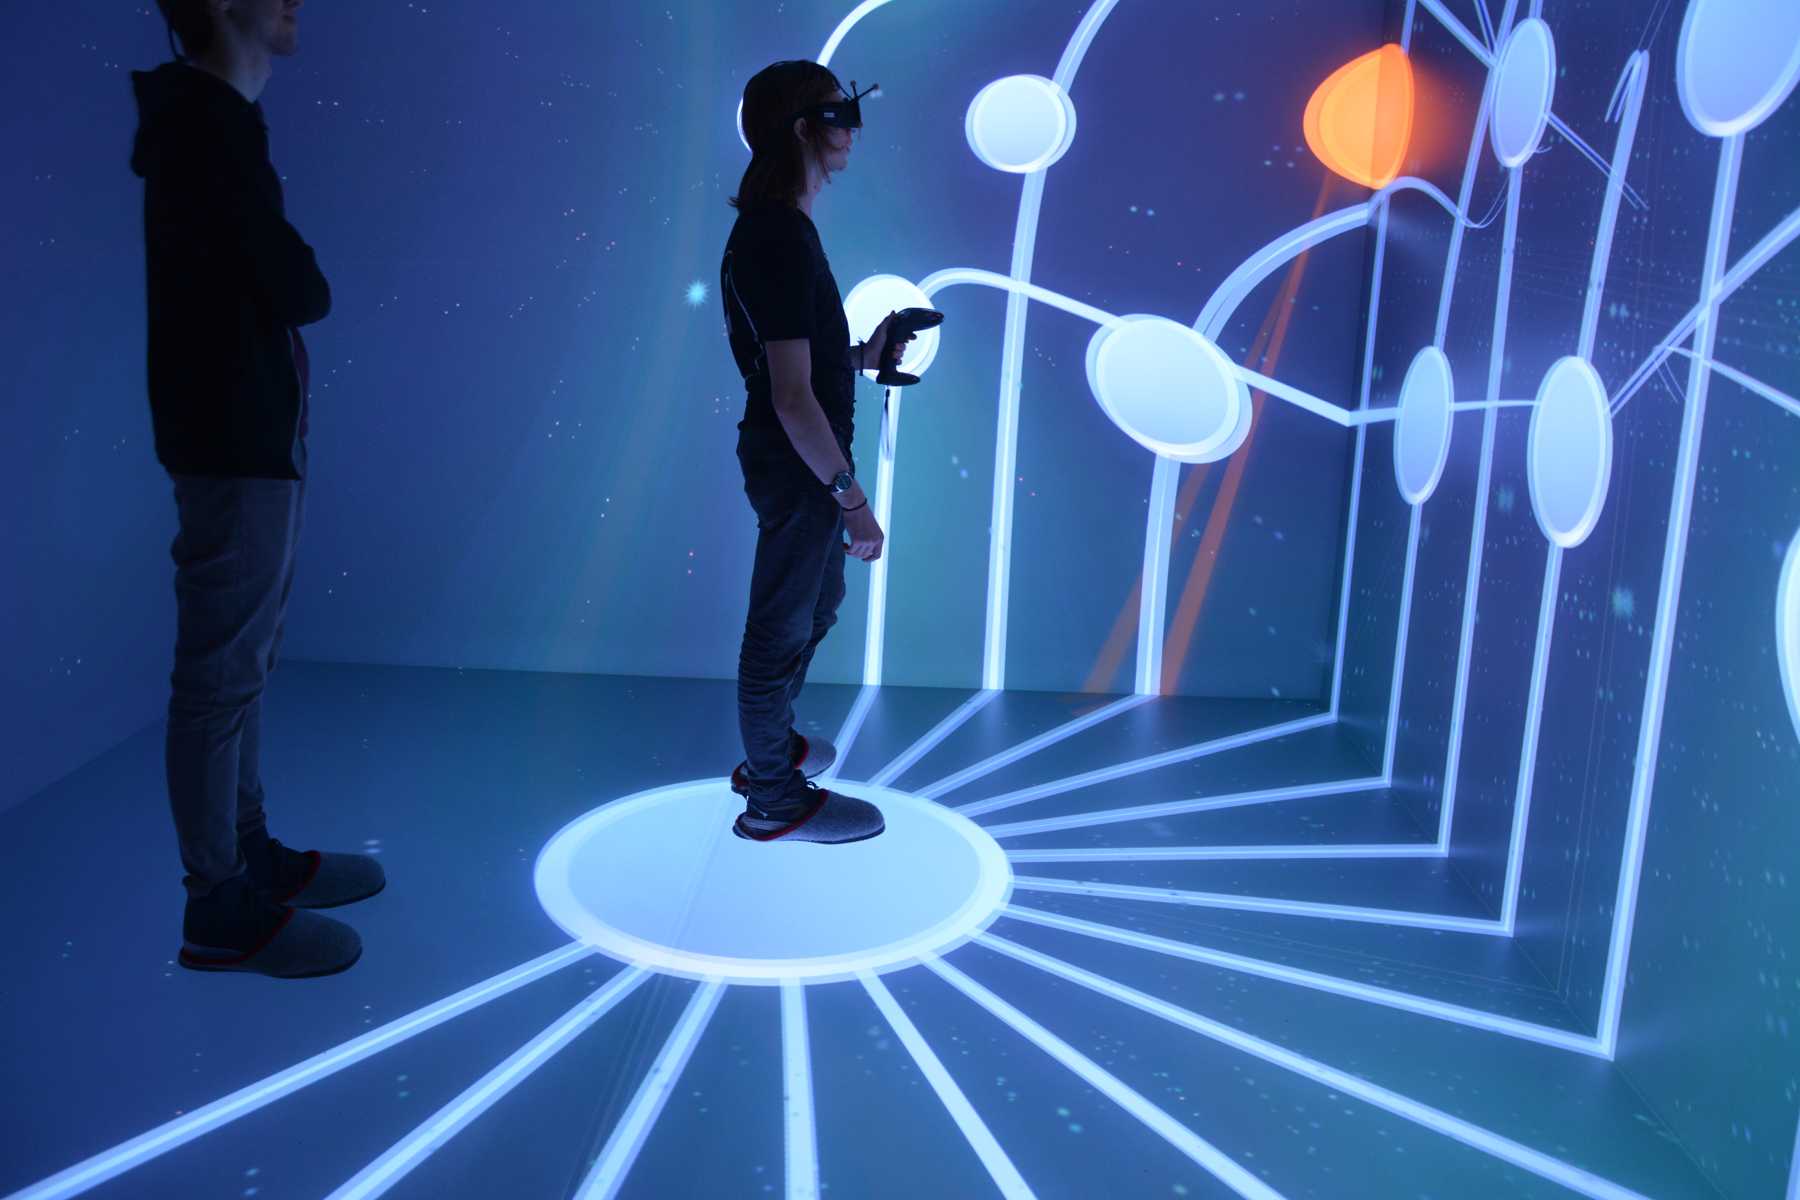
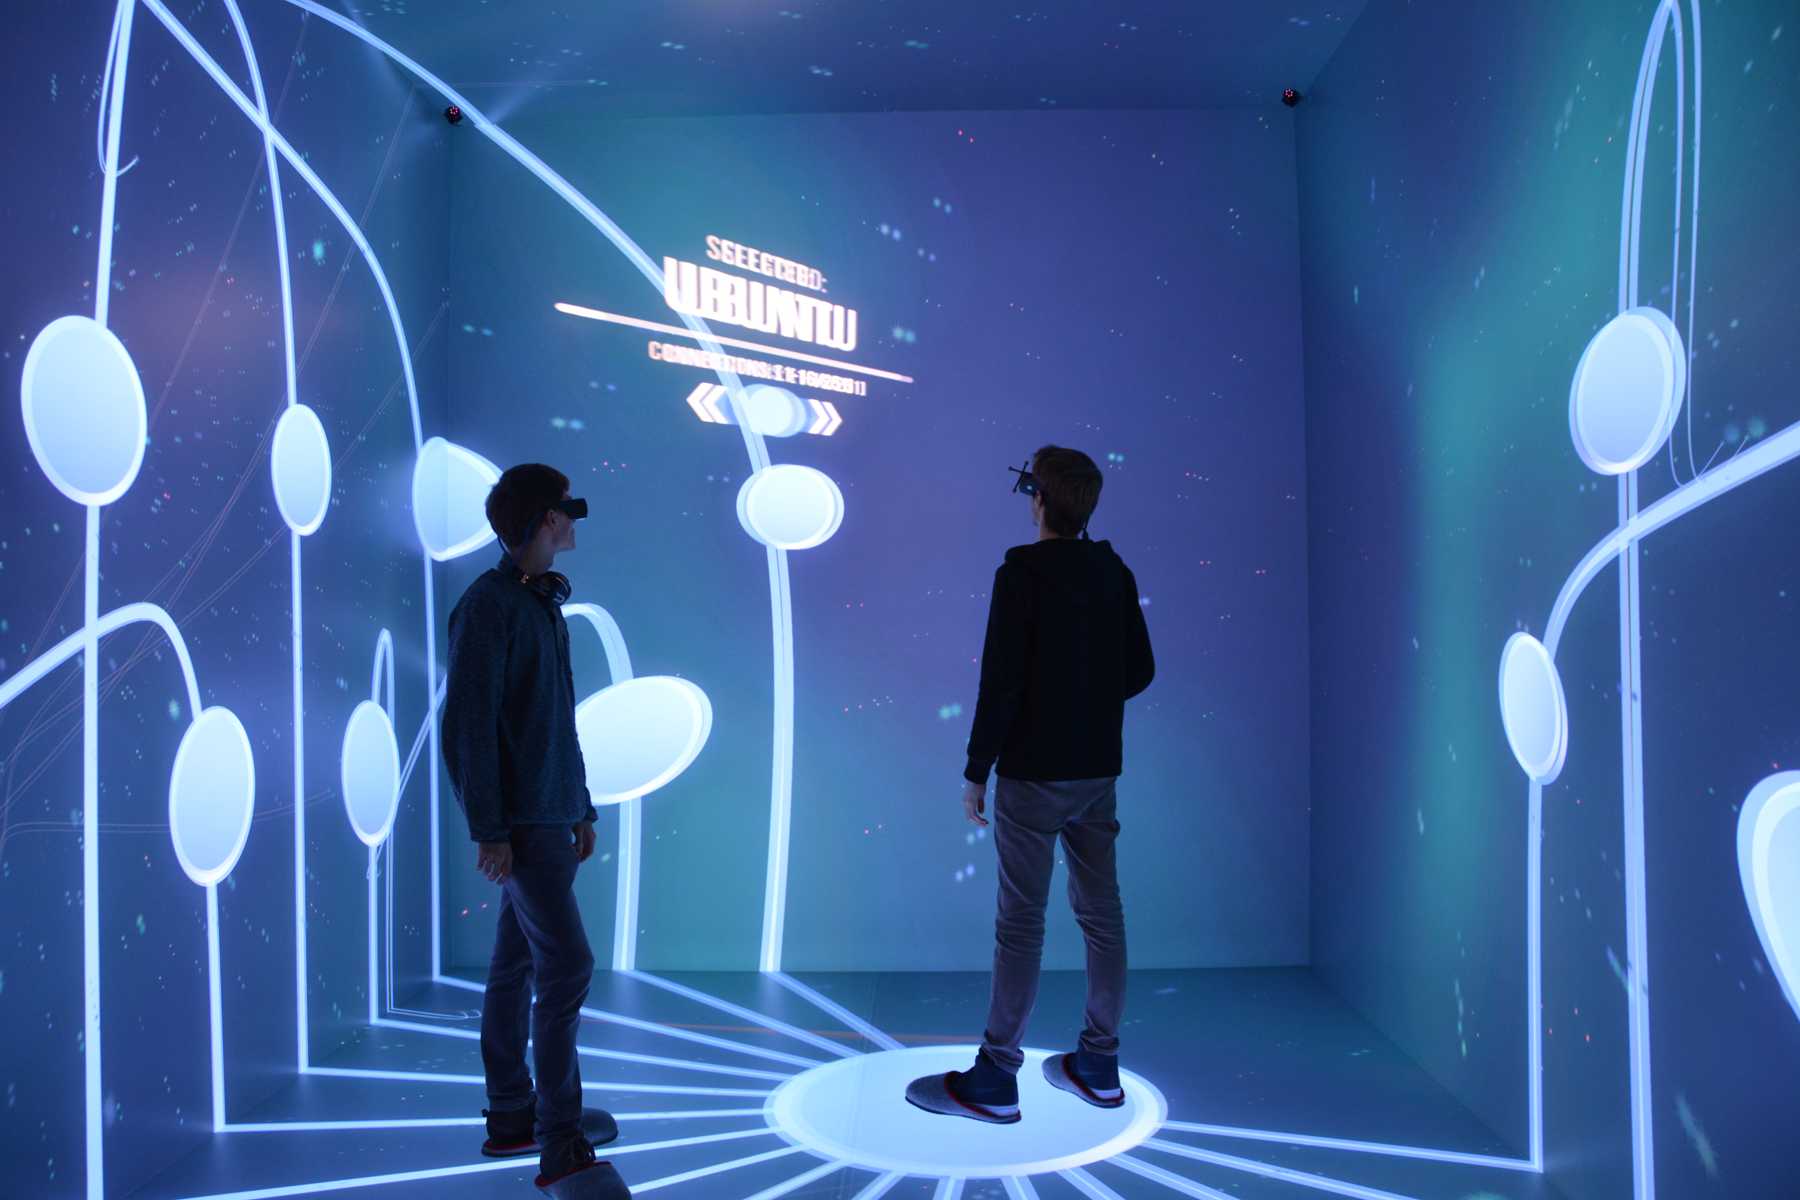
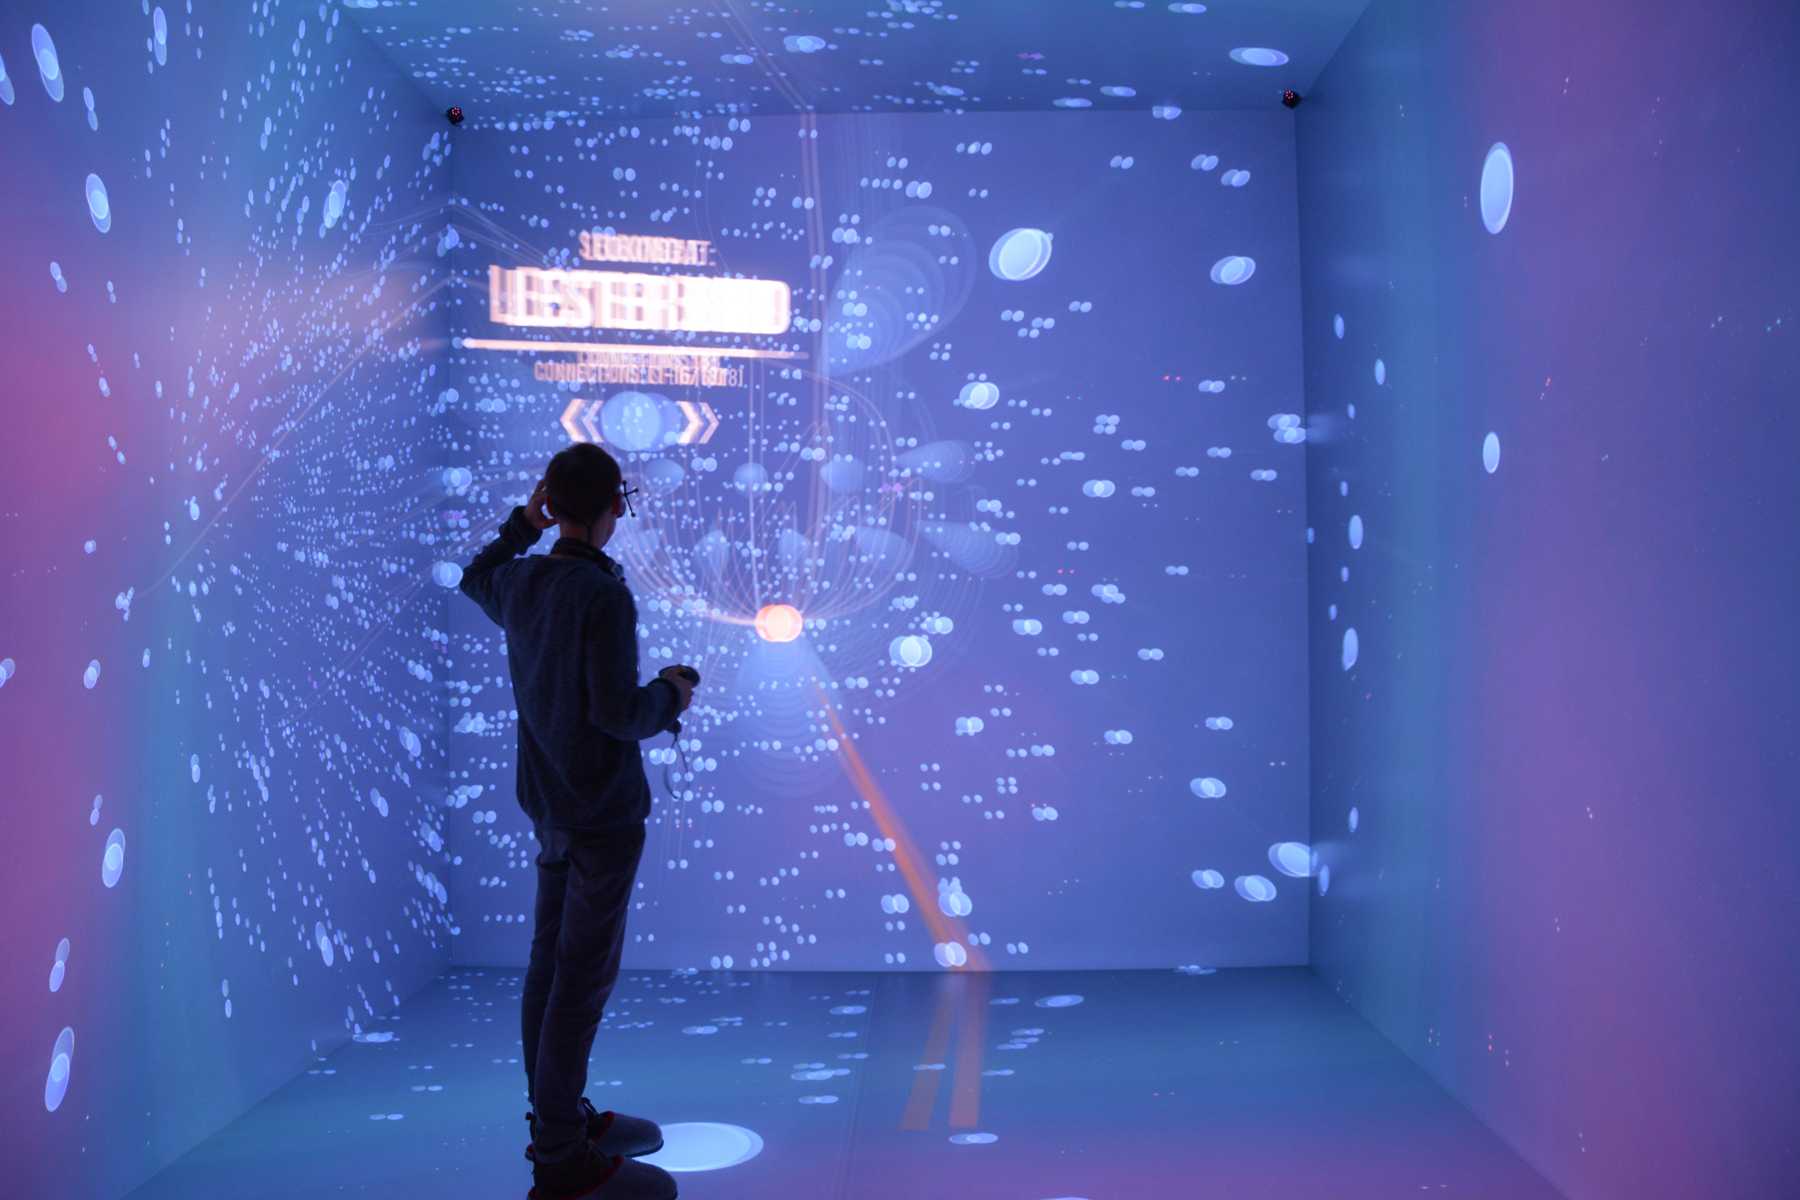
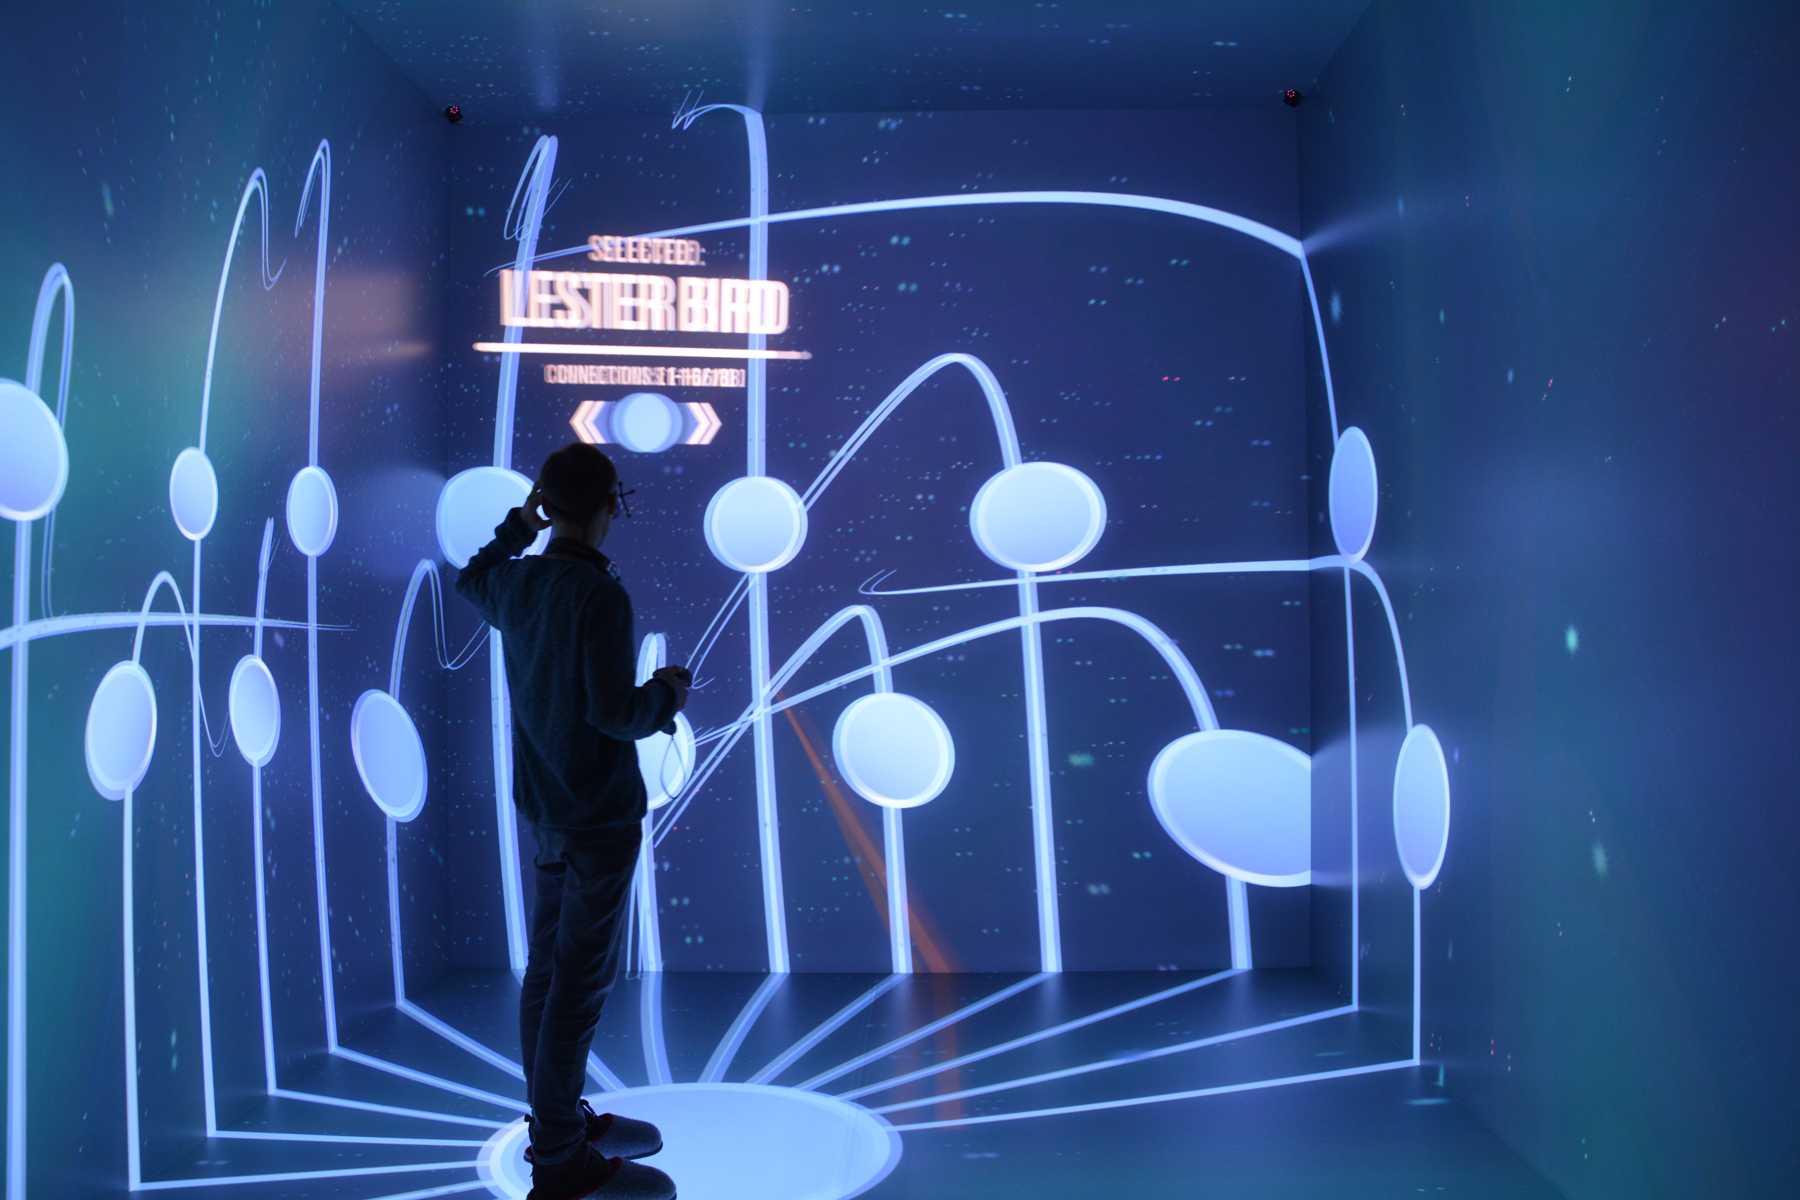
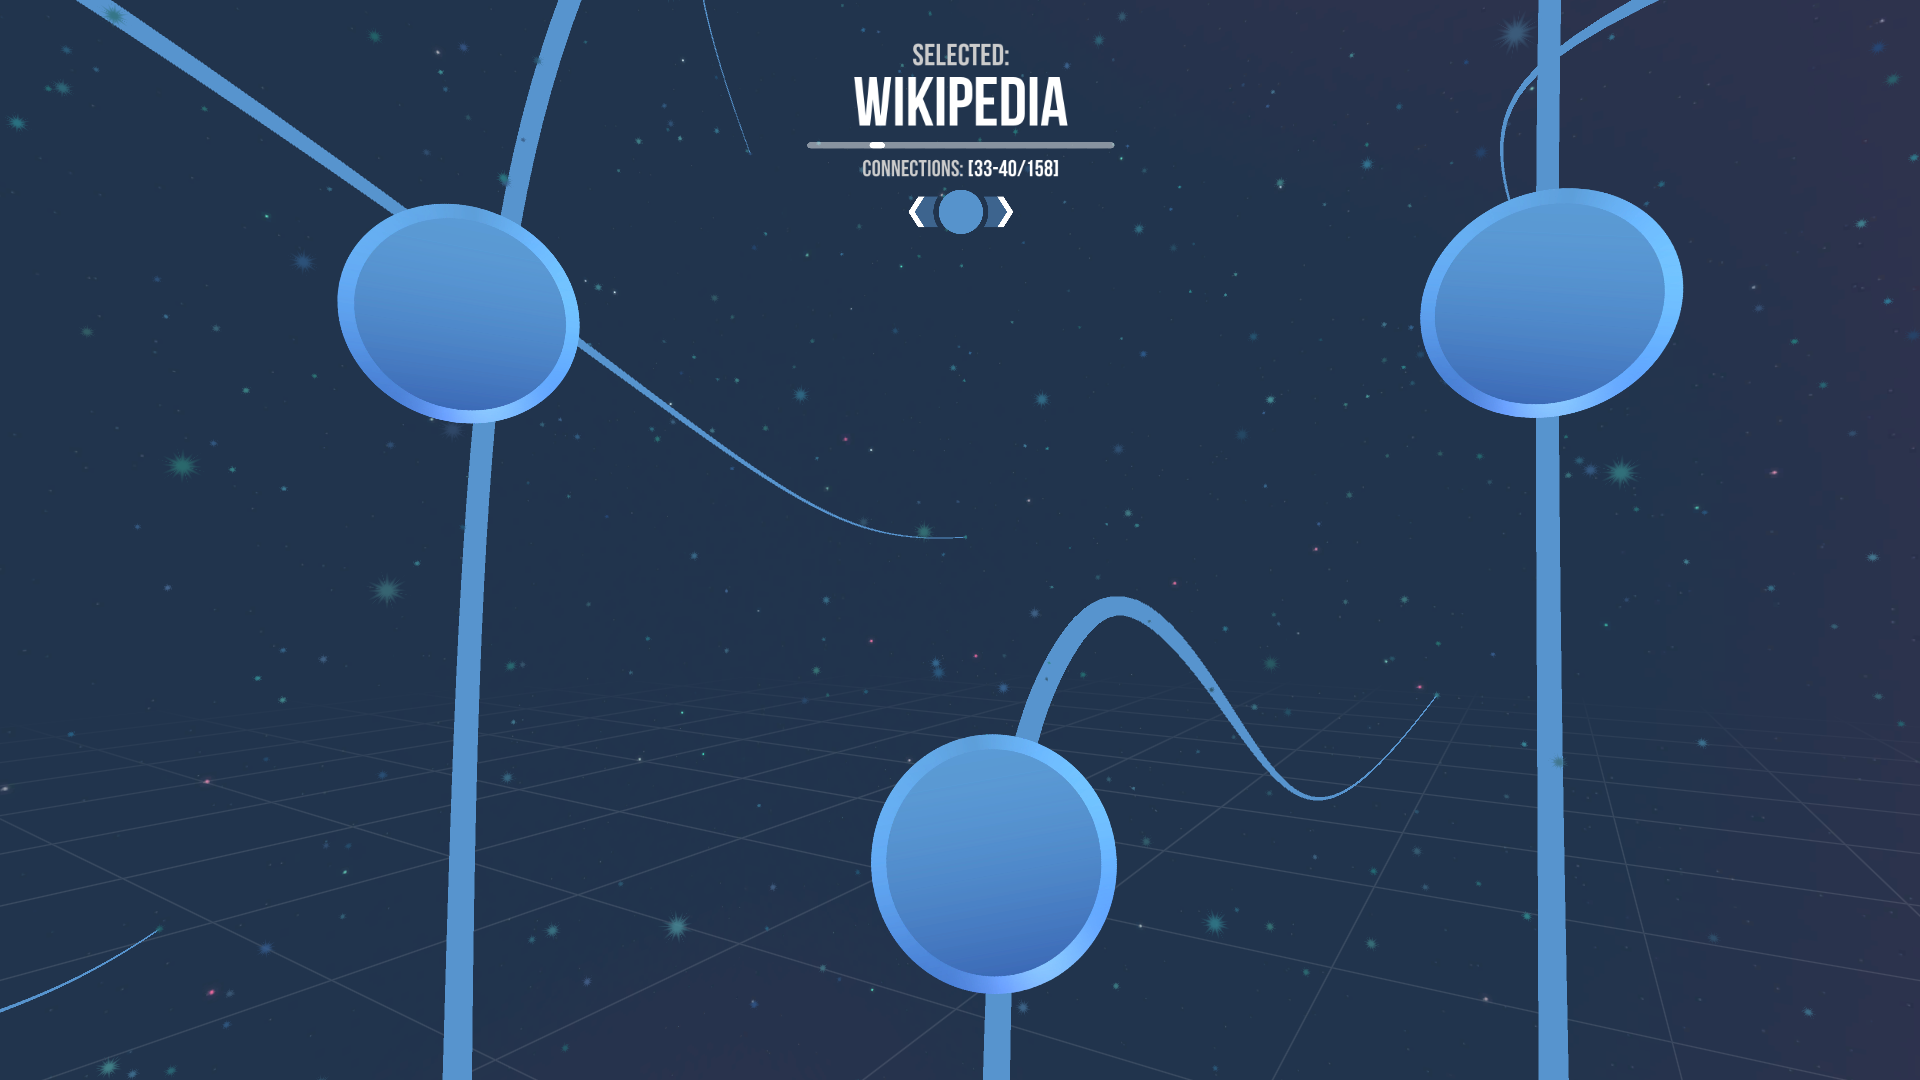
Interactive 3D visualization of Wikipedia articles and categories in a graph-like structure focused on highlighting the interconnections. The links between articles and the hierarchy of categories is represented as connections between nodes of graph.
- Build in Unity in a team of 4
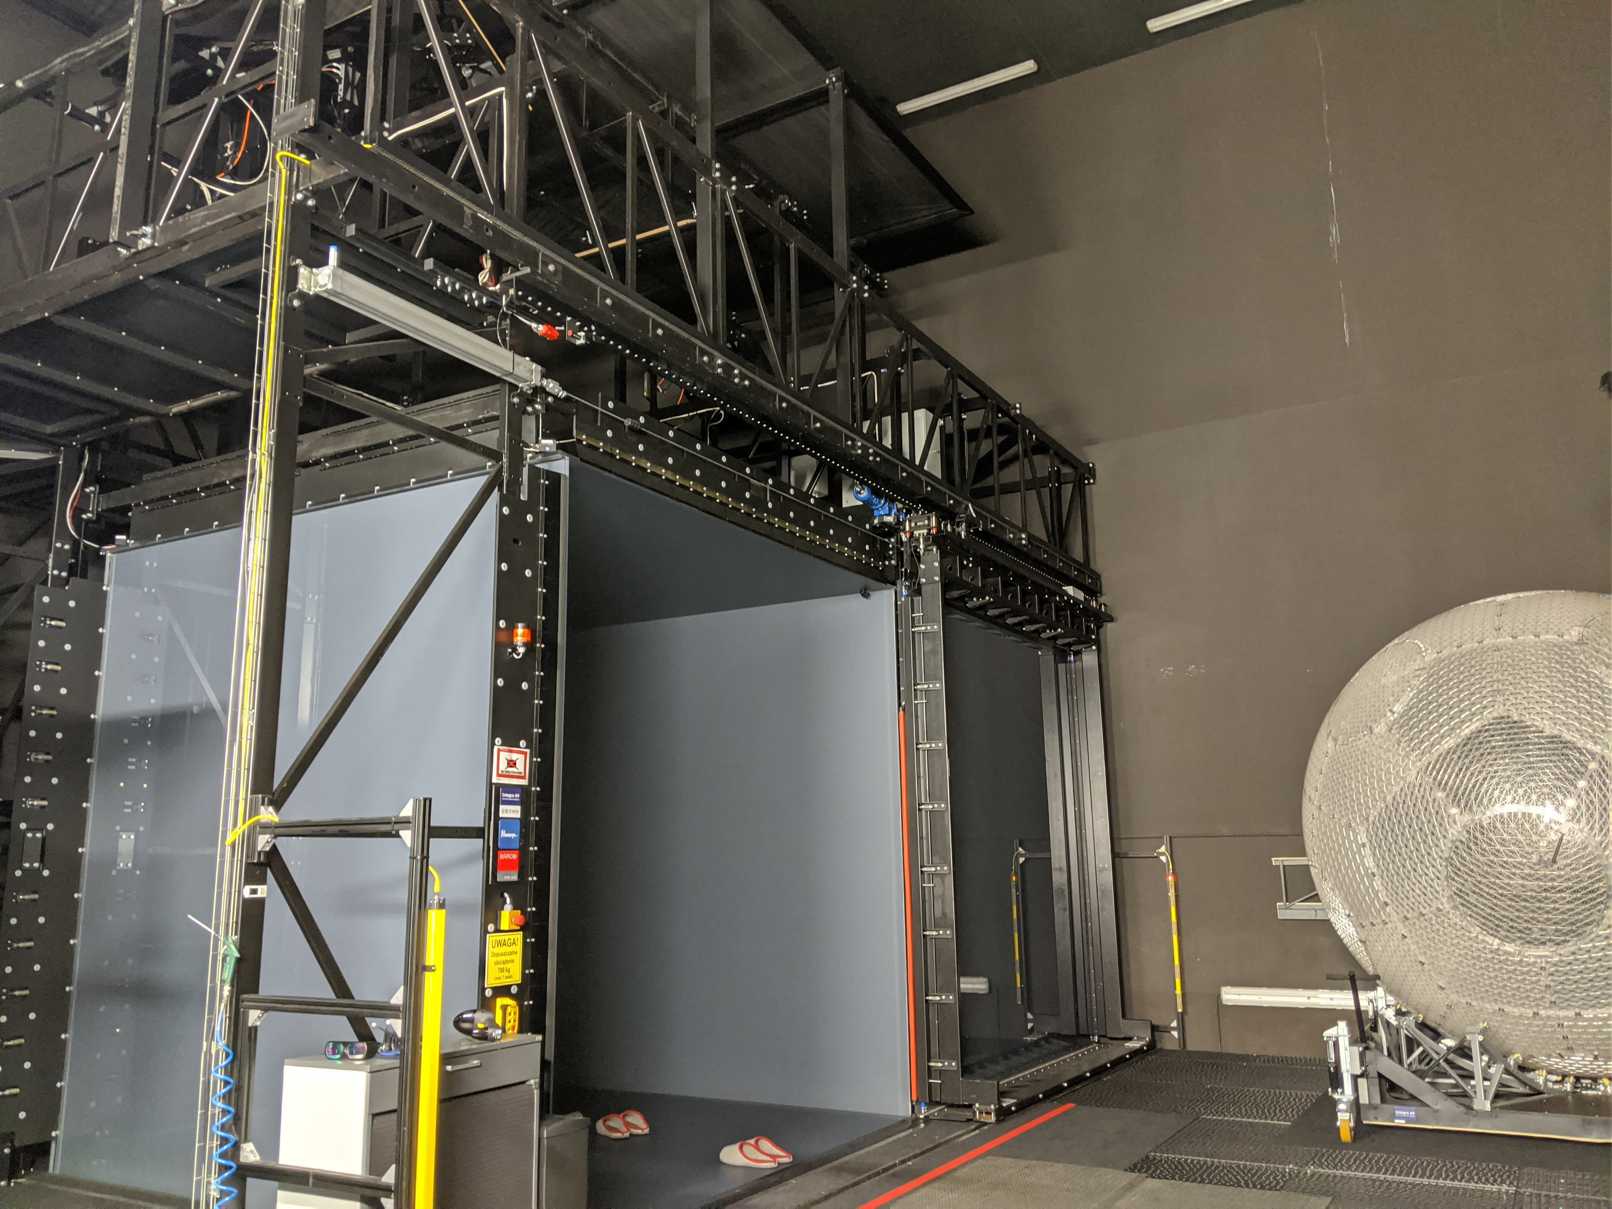
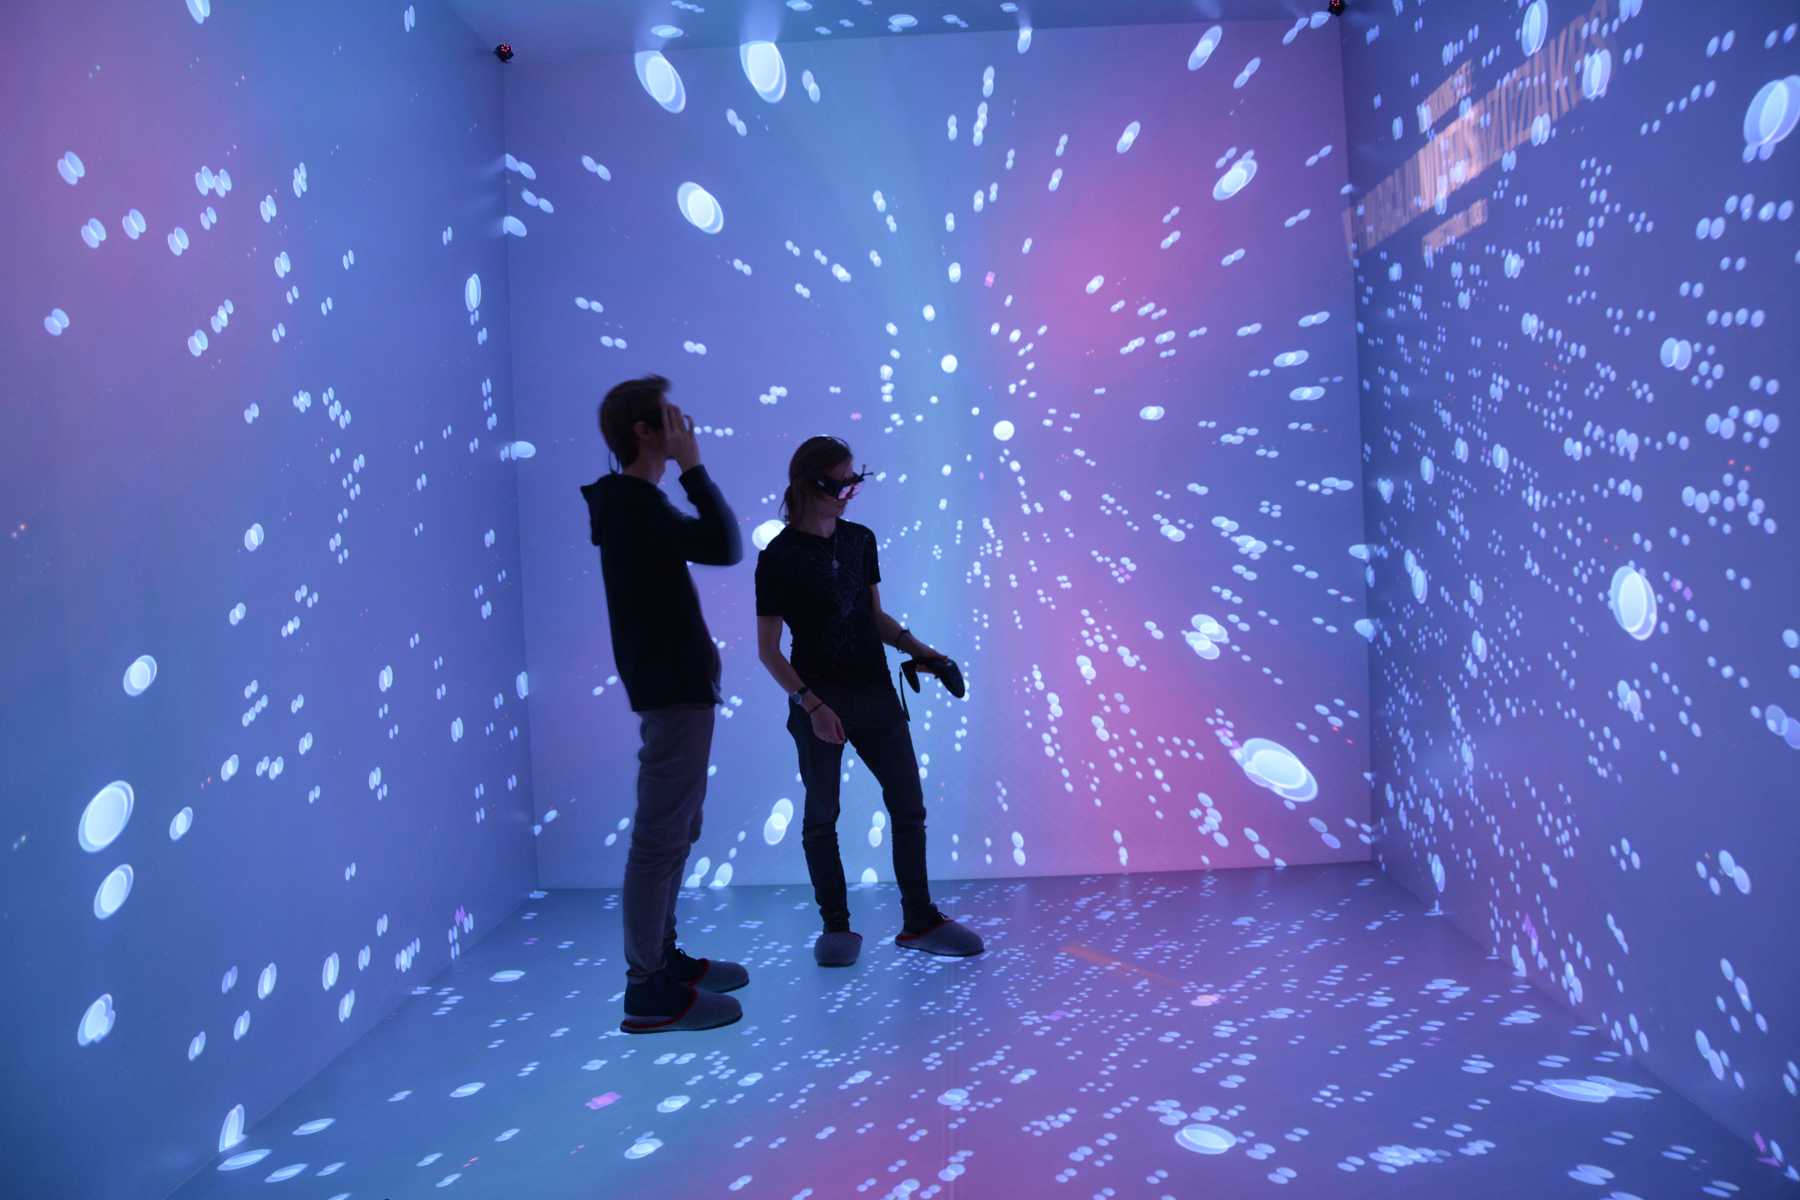
- Designed for the CAVE Environment in the Gdańsk University of Technology Immersive 3D Visualization Lab
WIKIGRAPH
Interactive 3D visualization of Wikipedia article connections in a graph structure Github
- Links between articles on a website represented as connections between the nodes of the graph
- Connections divided into accessible groups that can be scrolled
- Console with search functionality to quickly jump to a specific article
- Hierarchy of categories containing articles represented to make navigation easier
- Any wikipedia (en, pl...) can be turned into a data pack for the app through an automated process
About
Realized in a team of 4 friends as a Bachelor's thesis project in the Scrum methodology.- Visualisation engineUnity
- ProgrammingC#
- Data processing appWPF .NET
- Version control & RepositoryGit & GitHub
- Scrum project managementJira
-
Team Leader
- Comprehensive knowledge of project
- Code reviews
- Management & Meetings
-
Scrum Master
- Filling the backlog
- Organising sprints
CAVE Laboratory
From the beginning WikiGraph was designed with a 360° view in mind. Although it is fully functional on a normal PC, to experience the true strength of this visualisation a VR equipment is needed. During the project our team worked with the Immersive 3D Visualization Lab - a CAVE type laboratory at the Gdańsk University of Technology, to allow the app to run in their cubic virtual reality cave.